


At the end of Q2, a mid-sized environmental engineering firm pulls its numbers and finds something that doesn’t add up. Every project team logged full weeks. Utilization sat near 90% across the board, and yet margins came in six points below plan. Nobody could point to the moment it went wrong because nothing on paper ever looked wrong.
A resource management report is a structured, data-backed summary of how an organization uses its people, time, and budget across every active project, not just the one currently in focus. It surfaces who is overloaded, who is sitting idle, and where spend is drifting from plan. Even solid resource planning software cannot catch a six-point margin slip on its own, because it is only ever as useful as the data feeding it. A utilization number that only counts hours logged against a project will miss the kind of trouble the firm ran into.
This chapter covers what a resource management report is, what it is not, the components a useful one needs, the report types that come up most often, how these reports connect to real business decisions, and where reporting tends to break down in practice.
The definition above covers the mechanics. The confusion usually sets in at a different distinction: a resource management report is not a to-do list, and it is not a project status update. A status update says where a project stands today.
A resource management report explains why it stands there, using the capacity, workload, and cost data underneath it.
| What It Is | What It Is Not |
| A snapshot of how resources are allocated and used | A simple task list or project timeline |
| Data-driven, pulled from actual hours, costs, and availability | A subjective read on how a project “feels” |
| Focused on people, time, and budget across projects | Focused only on one project’s deliverables |
| Built to catch overload, gaps, and cost drift early | A retrospective document, read only after a project fails |
| Meant for recurring use (weekly, monthly, per sprint) | A one-time report generated and forgotten |
The six-point margin gap would have surfaced weeks earlier in a report tracking the right components, rather than waiting for quarter end to show up as a single disappointing number. The next question is what actually belongs in one.
A report is only as useful as what is built into it. Leave one component out and the picture is partial. So is every decision made from it.
Before any number is read, the headline needs to land first. A strong executive summary states in two or three sentences whether resources are on track, overextended, or underused. It is the answer at the top, not the buildup at the bottom, which matters because most executives decide within thirty seconds whether a report needs a closer read.
A good version reads something like ‘Team capacity is at 92% for the next two weeks, with the design team carrying the highest risk of overload heading into the product launch.’ One sentence. One number. One flag.
This component lays out how much working time each person has left once the meetings, time off, and existing commitments are factored in. Capacity is a theoretical ceiling: the total hours someone could technically work in a week. Availability is what is left after everything already on their plate is subtracted, and it is what drives every staffing decision.
A report should also show what is coming next. Visibility into the project pipeline lets capacity be planned ahead of a crunch, not scrambled together after the crunch has struck. A pipeline view is what turns ‘we will figure this out when it comes’ into ‘we already know week six is going to be tight so let’s plan around it now.’
Without this piece, every resource decision is reactive by default, made only after a client signs a contract or a deadline is confirmed, which is too late to make adjustments that do not feel rushed.
Utilization measures what percentage of someone's available time goes toward project work. It is one of the most-watched figures in any resource report, and also one of the most misread. On its own, a single utilization number does not tell the whole story.
An 85% utilization rate could mean a healthy, well-managed workload. It could also mean someone is one urgent request away from burnout. It depends entirely on what is driving this number and how consistent it has been over the span of time.
This component tracks planned spend against actual spend. It is usually where trouble surfaces first. A project can look perfectly on schedule while quietly burning through the budget more than planned. Time and money don’t always drift out of sync at the same rate or in the same direction.
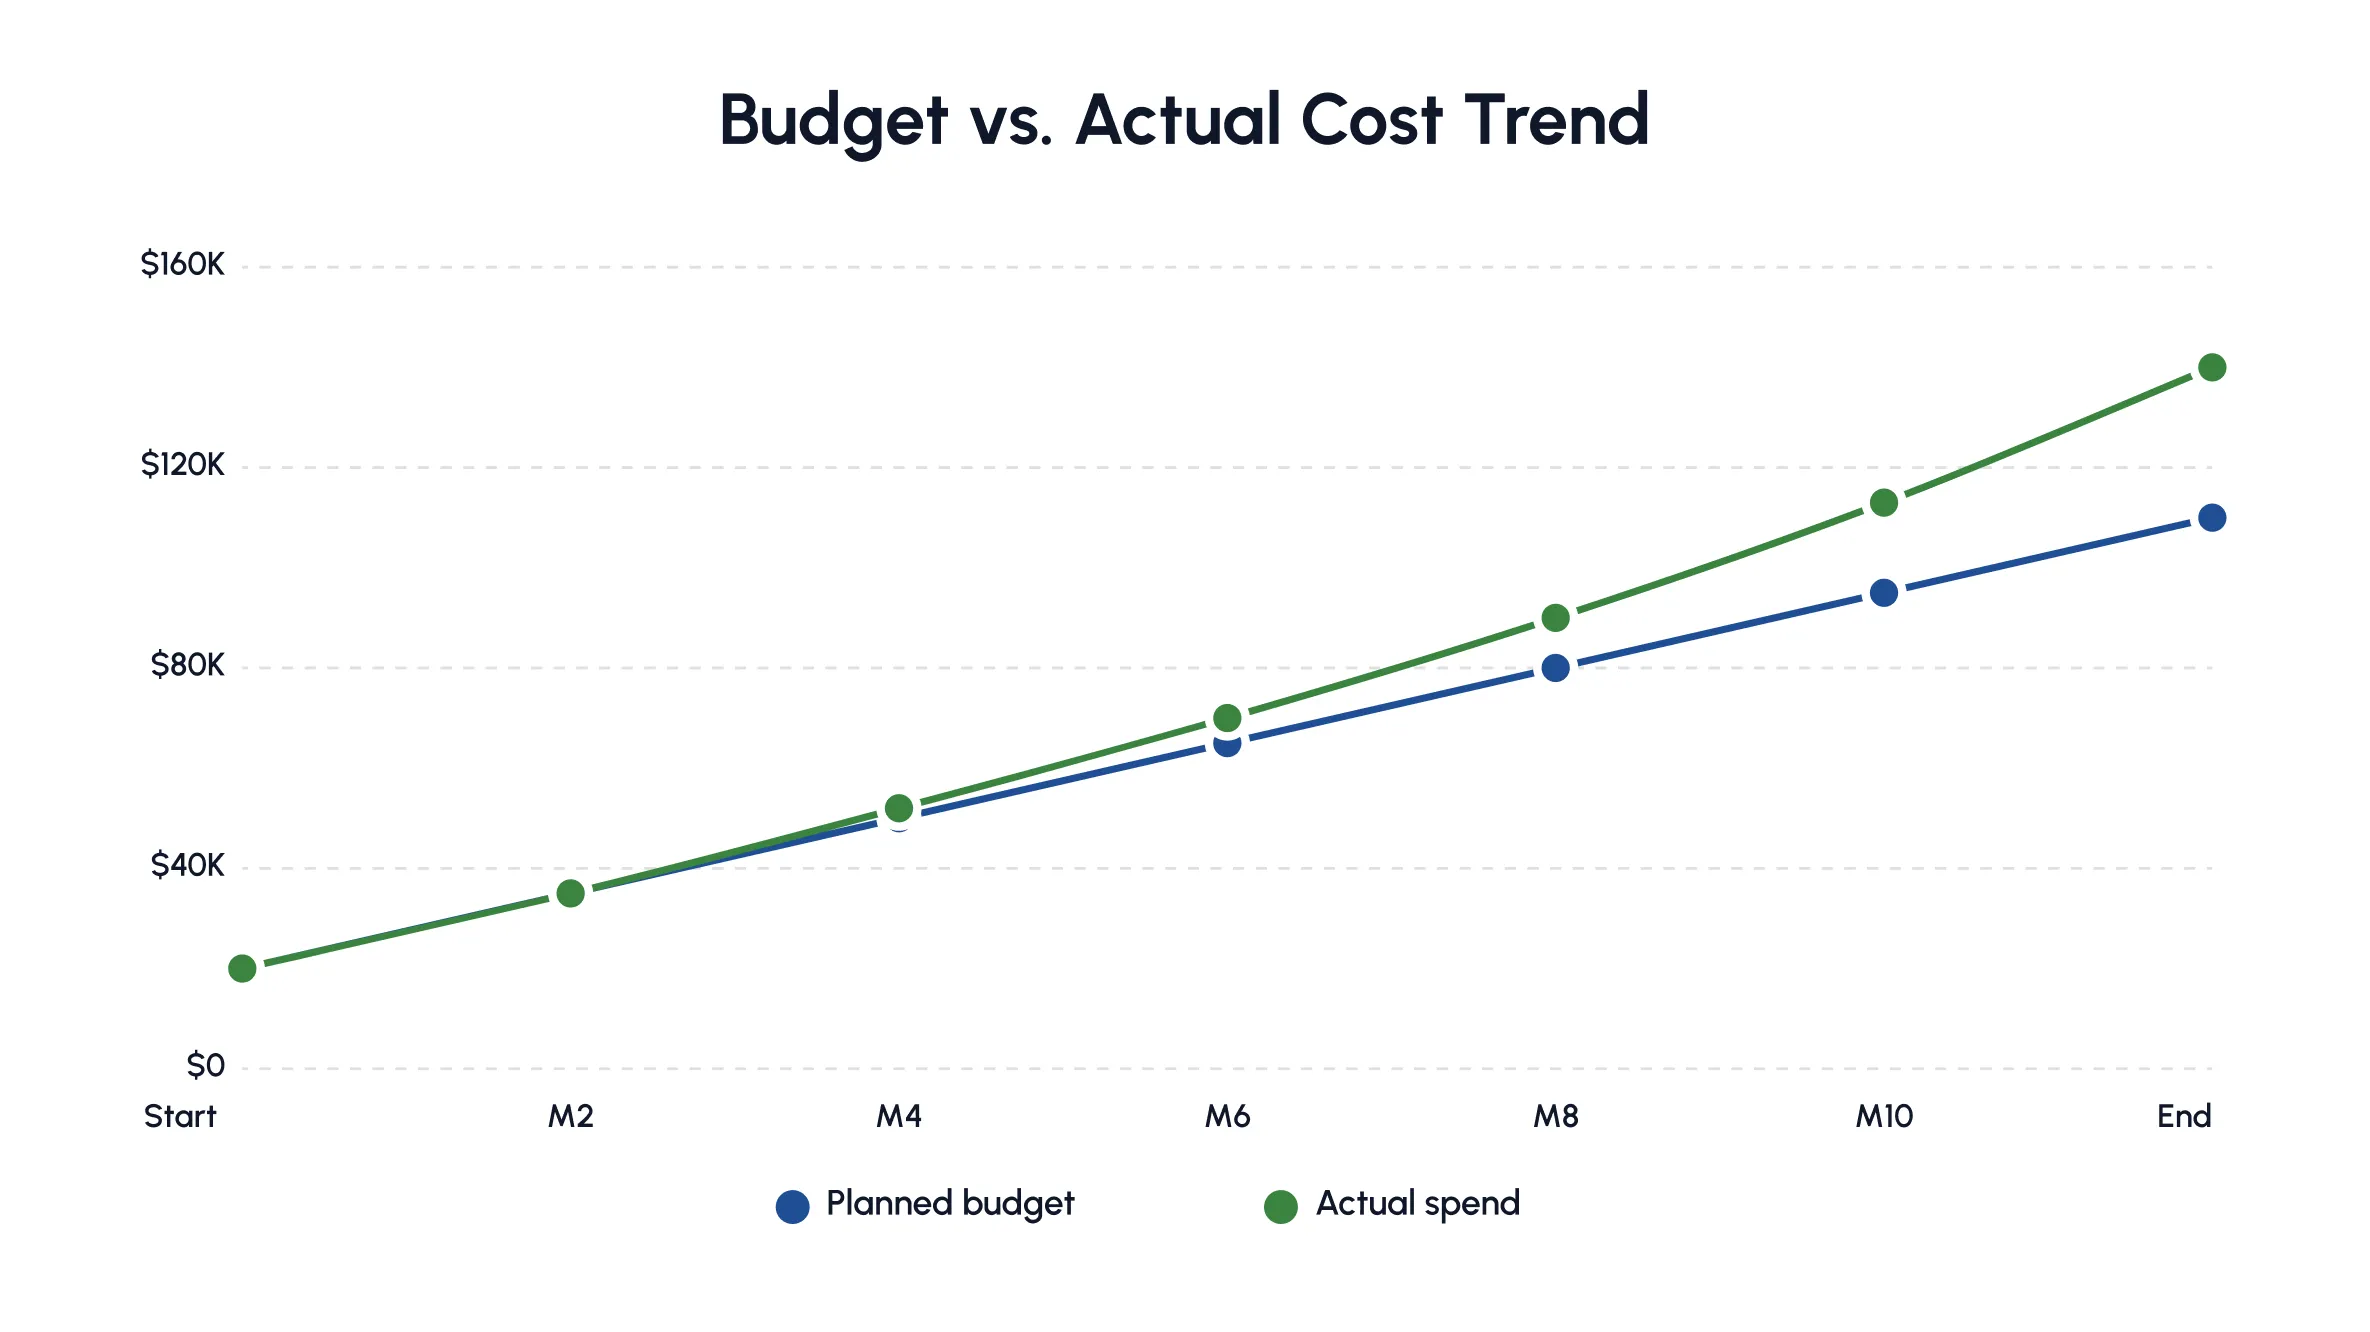
Drifts in budget, schedule, or scope are closer to the norm than the exception once nobody is watching closely.
Timelines capture when work is scheduled and how this schedule shifts once reality sets in. Building one properly is its own discipline, one covered in a dedicated timeline guide. A timeline that only exists as a static plan built at kickoff stops being useful the moment a task runs long (which is usually within the first week).
The last component flags where actual results diverge from the plan and what risk this creates going forward, covering both the scheduling risk a timeline might carry and the delivery risk a missed assignment creates. Solid monitoring and controlling habits build check-ins from day one. Catching a 10% overrun in the second week costs a lot less than catching it in the tenth.
A good variance section doesn’t just say ‘we’re 15% over budget.’ It says ‘we’re 15% over budget, driven mostly by unplanned overtime on the design phase. At this rate we’ll finish 22% over budget by project closing unless staffing changes.’
No single report usually carries all seven of these at once. In practice, they get split across distinct report types. Each one is designed to answer a specific question.
Different teams need different slices of this data, which is why resource reporting splits into eleven recurring types.
This report answers ‘who is free and when,’ broken down by day or hour depending on the granularity of the underlying data. It is typically the report pulled before a new deadline is promised to a client. Some teams call this a workload report instead, since availability and workload are two sides of the same coin. One shows the open hours. The other shows how many hours are already spoken for.
This report shows how much of each person’s time goes toward productive work versus admin, meetings, or idle stretches. It is usually expressed as a percentage of total available hours. A structural engineer logging 30 billable hours in a 40-hour week is at 75% utilization. Tracking this number over several weeks reveals a pattern, not a single busy day. Knowing why utilization matters and how it is calculated is worth the effort, since a shaky formula skews every decision built on it.
Where utilization looks backward, this report looks forward. It predicts available capacity in coming weeks or months based on current commitments and known time off. Business development leads lean on the report before promising a delivery date. It answers a specific question: If the next proposal lands, is there actually enough capacity behind it to deliver?
This report flags the mismatch between what a project needs and what a team can currently provide, whether it is a skill gap, a licensing gap, or a raw headcount shortage. A proper gap analysis catches the less obvious kind too. Picture a firm with five generalist engineers and nobody holding the structural PE license a state contract requires.
This report tracks hours logged against tasks and projects (usually entered daily or weekly by each team member). It is the least glamorous report on the list, and also the raw data source that keeps every utilization and budget report honest. A utilization report built on estimated hours rather than logged ones is really just a guess wearing a percentage sign.
This report shows how far a project has come relative to its plan, tracked against milestones rather than raw hours worked. It works best read as part of a full project cycle, since progress only means something in the context of what came before and after it. A project at ‘70% complete’ reads very differently depending on whether the number reflects the easier first half or the harder second half of the project.
This report compares what was planned across resources, budget, and timeline against what actually happened (laid side by side) rather than buried across separate documents. It is one of the clearest ways to catch planning blind spots before they repeat. A team that consistently underestimates design hours by 20% will keep making the same mistake project after project until someone measures the gap.
This report shows exactly which resources are assigned to which projects. This is often where the quiet overcommitment behind a margin slip begins. Long before it ever reaches a quarterly report. It is less a record of what happened and more a live map of current commitments. Pairing it with the right allocation tools turns allocation into a direct lever for cost control, since every reassignment has a budget consequence attached to it.
This report zooms out to cost, covering labor spend, project budget, and overall financial health across the resource pool. It is usually the one finance and firm leadership care about most. It translates resource decisions directly into dollars, connecting an engineer’s billable hours to what a project actually costs against what it is expected to earn. Where the utilization and timesheet reports show activity, the financial report is where that activity finally gets priced.
This report compares project revenue against resource costs to show which engagements are genuinely worth the time invested, not just which ones kept everyone busy. A project can look fully staffed and on schedule while still losing money. If the hours invested cost more than the contract is worth, the report catches this mismatch before the project closes out.
This report catalogues available resources and their skills, close in spirit to a skills inventory, so capability gaps surface before a project needs them filled. It turns ‘who do we have’ into something more specific than a headcount list. It covers certifications, licenses, and specialists the way the resource gap report above does, but as a standing reference rather than a project-by-project check.
Knowing what each report answers matters most once it is tied back to the decisions leadership is actually trying to make.
Reports do not exist to fill a folder. Each one supports a specific kind of business decision. Mapping reports to decisions keeps good data from going unused.
| Business Factor | Supporting Report(s) | Why It Matters |
| Strategic Resource Allocation | Resource Allocation, Availability | Ensures the right people are assigned to the highest-priority work first |
| Profitability And Cost Control | Financial, Project Profitability | Shows which projects generate real margin versus which quietly drain budget |
| Continuous Operational Improvement | Planned vs Actuals, Variance | Highlights recurring planning errors before they repeat project after project |
| Capacity Optimization | Capacity Forecasting, Utilization | Keeps capacity matched to demand, avoiding both overload and idle time |
| Long-Term Strategic Forecasting | Capacity Forecasting, Resource Gap | Feeds hiring and training decisions months ahead of a shortage |
| Burnout Prevention | Utilization, Availability | Flags sustained overwork before it turns into attrition |
| Increased Employee Productivity | Timesheets, Utilization | Identifies where time is lost to low-value work |
| Workload Management | Resource Allocation, Availability | Balances assignments instead of overloading top performers |
| Project Prioritization | Resource Gap, Project Progress | Helps leadership decide which projects get resources first when capacity is tight |
This link between daily reporting and long-range strategy is not optional or theoretical. McKinsey’s research on tying decisions to strategy makes the case that organizations lose real value when operational calls are made in isolation from the bigger picture. Resource management is a textbook example of exactly this risk.
Teams of very different sizes (from lean agencies to large enterprises) pull the right report to make the call in front of them, and which report gets pulled changes depending on what is actually at stake.
None of this holds up, though, if the data underneath a report cannot be trusted. This is usually where things start to unravel.
Even with the right report types in place, reporting fails quietly more often than it fails loudly. Here is where it usually goes wrong.
Most reporting tools track project work well and everything else poorly. Site visits, change-order calls, internal meetings, and one-off requests eat into a day just as much as billable work does. When a report does not capture these, utilization numbers look artificially healthy while the team quietly falls behind. An engineer who looks 60% utilized on paper might actually be running close to capacity once the unlogged site visits and change-order calls are counted honestly.
A report showing ‘5 available engineers’ without mentioning their specific skill sets is misleading and only surfaces later. A structural engineer and a geotechnical engineer aren’t interchangeable just because they share a job title. Assigning by headcount (not skill fit) is a common reason projects stall two weeks after being ‘resourced’. The fix? Tagging people by skill rather than role alone. This means the underlying data has to be more detailed than most teams bother collecting at first.
Sometimes the problem isn’t a bad system. It is no system at all. Even within one team, resource data often lives only in someone’s head or personal notebook, not in a shared record. This means the ‘data’ does not exist anywhere a report could actually access it. A manager who’s been on a team for years might know who is at what capacity without checking any data. But this knowledge disappears the moment they go on leave or decide to leave. The report built after that has nothing to draw on.
Once teams start capturing data, a different problem shows up. The data ends up scattered across tools that do not talk to each other. Timesheet data lives in a tracker. Budgets live in an isolated Excel sheet. The project timeline lives in a third system nobody remembers to update. Nobody is accountable for syncing everything. This is not a trust problem (yet). It is a plumbing problem. Any report that is based on all three has to be assembled by hand, one export at a time (which is error-prone), before anyone starts with the actual analysis.
Pulling one weekly report might mean logging into a timesheet tool, exporting a budget sheet, and even cross-checking a calendar. This requires switching between all three multiple times before the report is even half done. Each handoff is a fresh chance to paste a number into the wrong row or apply the wrong formula. The error rarely gets caught by whoever compiled the report. It gets caught by the reviewer who questions a number that looks off.
Some reports display data at the weekly or monthly level, which hides the daily workload spikes. For instance, a resource who is slammed for three straight days but shows up as merely ‘on track’ once these hours are averaged across the month. Others show only daily data, which buries the bigger trend under noise. What is actually needed is one flexible view to zoom in on a single busy day (down to each hour) or zoom out to the full month/year depending on the question being asked.
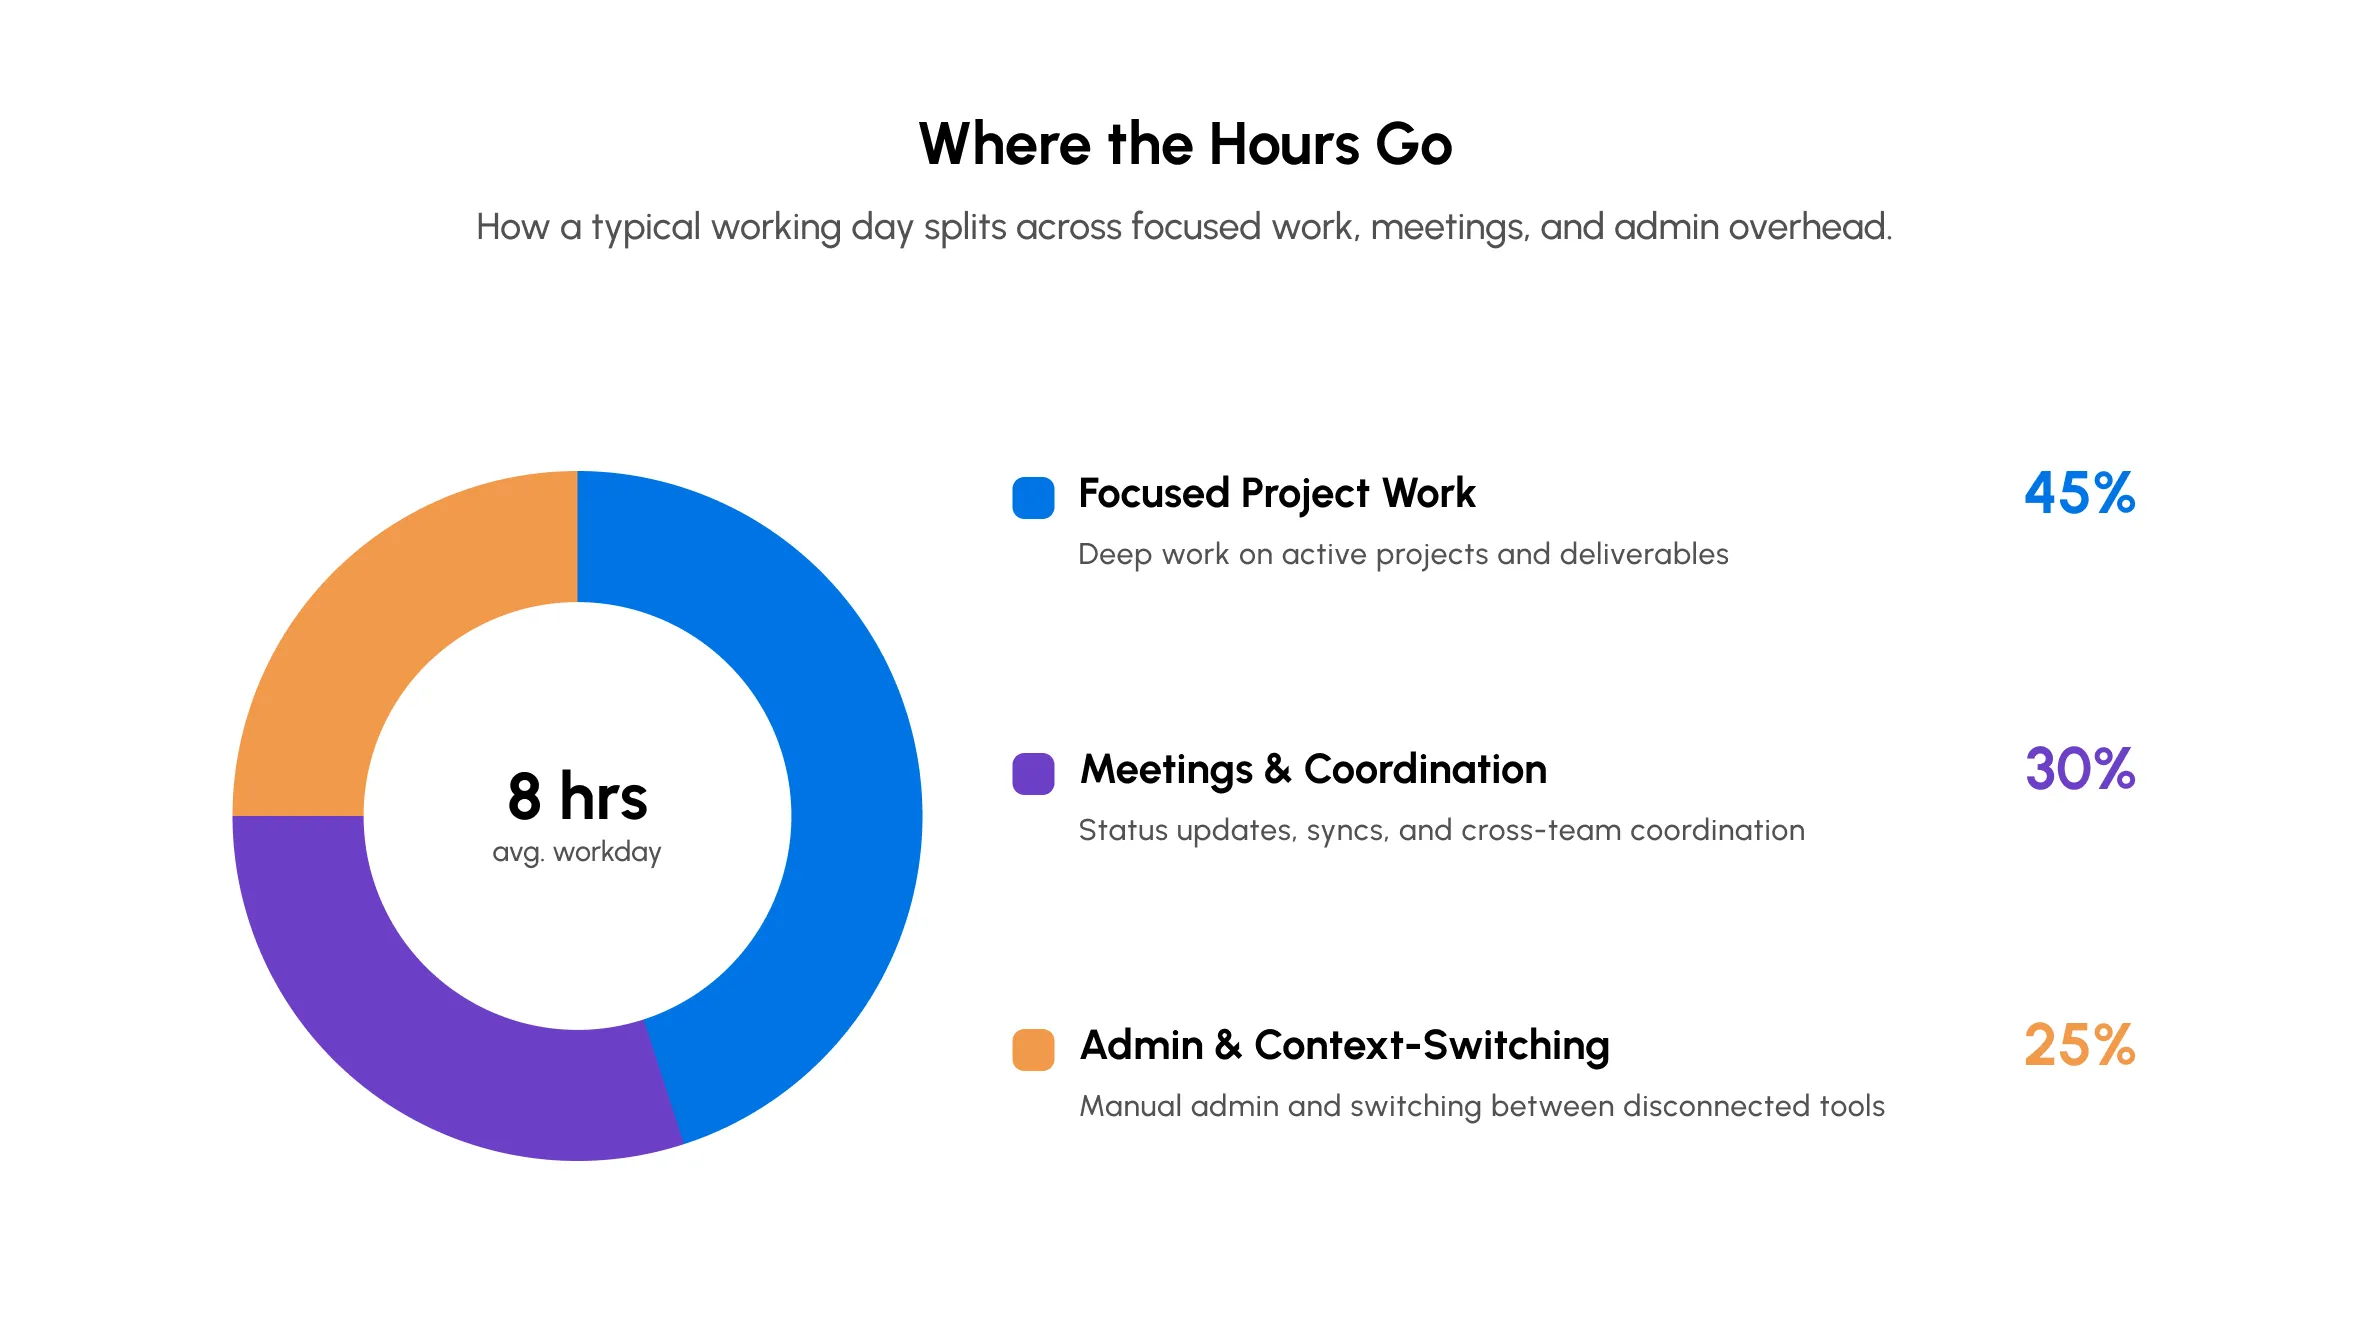
Plenty of reports show where things stand today without ever comparing them against what was originally planned. Without this comparison, there is no way to tell whether planning accuracy is genuinely improving over time or simply repeating the same estimation mistakes quarter after quarter on every new project.
None of this is a case against reporting itself. It is a case for pulling it into one place instead of five. This is exactly the gap purpose-built software closes.
Most of the problems above trace back to one root cause: Data is scattered across too many places. Centralizing this data into a single platform doesn’t just simplify reporting; it makes the reports themselves trustworthy again.
When availability, utilization, budget, and timeline data all live in one system, teams stop reconciling three conflicting numbers before every meeting. A project lead and a finance stakeholder end up looking at the same figures, which is the fastest way to rebuild the trust scattered spreadsheets have worn down. Setting this up is not purely a software decision either. Someone still has to define what counts as ‘availability’ and how a partial day off gets logged. Getting these definitions wrong just recreates the trust problem inside a fancier tool.
This is usually the point where a growing engineering consultancy outgrows a shared spreadsheet but does not need or want to pay for the kind of enterprise-grade suite designed for a 10,000-person conglomerate. A centralized system is only as trustworthy as the person who configured its rules.
Instead of pulling data from five tools by hand every Friday, a centralized tool generates reports as work happens. This shift removes the lag that used to sit between something going wrong and someone noticing it, since a manager no longer has to wait for a weekly compilation cycle to see a project has quietly drifted over budget.
This changes the rhythm of how problems get caught. A budget overrun that would have surfaced at the end of the month now shows up the same week it starts. There is still enough runway left in the project to course-correct. This kind of immediacy tracks with a broader shift researchers are tracking across leadership, where making sound calls with complete information is fast becoming a core expectation, not just a nice-to-have. Spotting a problem early only matters if someone with the authority to act is looking at the same numbers (at the same time).
The end goal is not a prettier dashboard. It is faster, better-informed decisions about who works on what and where the budget actually goes. A centralized report doesn’t just tell a manager that a project is behind. It tells them why, whether this is a skill gap, an unplanned dependency, or a resource who’s been quietly overloaded for three weeks straight.
A 340-person engineering consultancy running concurrent infrastructure, structural, and environmental assessment projects across four regional offices ran into exactly this tangle before centralizing its reporting. Project leads were compiling utilization and budget numbers from five spreadsheets every Friday, and utilization looked healthy on paper, hovering around 82%, while margins quietly slipped project after project.
Once the firm moved to a single platform to track availability, utilization, and budget together, the gap showed up fast. Several senior engineers ran closer to 95% once non-billable site visits and change-order calls were counted properly, while two mid-level engineers sat well under 60%. Rebalancing assignments against the picture cut overtime costs within the first full quarter and brought margin forecasting back in line with actuals.
*The firm’s name is not shared to protect its privacy.
Honeywell ran into a related version of the problem: fragmented, manual coordination across people and equipment, until switching to a single scheduling software cut out a substantial share of this back-and-forth. The underlying pattern tends to look remarkably similar whether the resources were human or non-human.
It's worth circling back to the eleven report types from earlier, because centralizing the data behind them doesn't just clean things up in the background. It changes what each report can actually tell you.
| The Breakdown | What Changes for the Report |
| Ignoring Non-Project and Ad-Hoc Work | The engineer who looked 60% utilized while actually drowning in unlogged site visits now shows up closer to their real number, since the report finally counts the whole day. |
| Treating Resources as Interchangeable | A resource gap report stops saying ‘we have five engineers’ and starts saying which one of those five actually holds the license the contract needs. |
| Siloed Resource Data | The availability report doesn’t go blank the day that one manager who tracked everything in their head finally goes on leave. |
| Disparate Sources of Truth | No longer are there three slightly different utilization numbers for the same person in the same week, just one, the one everyone actually believes. |
| Task Switching Overhead | A financial report stops carrying forward the transposed number or the outdated formula that used to sneak in somewhere between the fourth export and the fifth. |
| Rigid Granularity | The engineer who was slammed for three straight days shows up as slammed, instead of getting averaged into ‘on track’ the moment the month rolls up. |
| Missing Planned vs Actuals | The firm that underestimated design hours on the last three projects finally has a report that says so, instead of relearning that lesson on the fourth. |
This is essentially the role eResource Scheduler plays for teams tired of stitching reports together by hand every week. One platform holds availability, utilization, budget, and timeline, so the reports reviewed are no longer a Friday-afternoon scramble. They are something a team can actually trust at a glance.
Two numbers are worth remembering from this chapter. Utilization in the 75-85% range signals healthy capacity, not hidden overload. Yet 59% of engineering firms still manage resource allocation through manual planning, meetings, and spreadsheets rather than software built for it, according to the 2026 Engineering Industry Benchmark Report. Both point to the same gap: how busy a team looks versus how available it actually is, a gap most generic resource management tools do not close on their own.
This is the same gap this whole chapter circles back to. The environmental engineering firm from the introduction wasn’t short on effort or full weeks; it was short on a report that separates utilization from profitability. That is precisely the gap a resource management report closes.
The fix was never more reports. It was the right reports, from one reliable source, read by the right people at the right depth. Capacity planning stops guessing, and budget drift gets caught in week two instead of week ten. This is what the next chapter covers: turning the utilization numbers from this chapter into a way to catch margin slip while it is still a one-point drift, not a six-point surprise.

 ALL FEATURES INCLUDED