



Two projects can look almost identical on paper. Same size. Same rough scope. Same category of client. Same experienced team assigned. One closes at a healthy 33% margin while the other closes at 7%. Nobody on the team can point to a single moment where it went wrong. There were no dramatic deadline misses, client blowups, or obvious disasters. Just a slow, quiet drift that shows up only when someone adds up the final numbers and asks why two projects that started the same way ended so differently.
This gap is never really about the client or the team’s effort. It comes down to what is measured along the way and what’s estimated on instinct. The project that held its margin was the one where someone could see (in real time) how actual hours compared to planned ones. Chapter 1 covered what time tracking is and why logging hours matters. This chapter covers what happens once the tracked data is applied.
You will see how time tracking data turns a rough guess into a forecast you can defend with your team’s history, and how it lets you check a project’s real profitability while there is still time, not three weeks after the invoice has gone out. We will also look at where this shift tends to stall in practice, because a good framework rarely survives contact with a fully booked calendar and a team that has always estimated by gut feel.
Estimation is a team’s best guess about how long something will take and what it will cost, made before the work has actually started. Businesses do it because clients need a number before they sign, teams need a plan before they start building, and leadership needs to know if a project is even worth taking on. Without an estimate, an organization is flying blind.
Here is a part nobody likes to admit. Estimation has quietly become something people dodge rather than something they do honestly, and it happens for three specific reasons.
1. The Illusion of Certainty: Project leads are asked to give a confident number early on, at the exact point when they have the least information they will ever have about the project. This rough guess is then treated as a locked-in promise the moment it leaves their mouth, even though nothing about it was ever certain.
Separate the Estimate from the Pitch Keep the internal, honest estimate completely separate from the number sales uses to win the deal. The moment those two numbers merge into one, someone always ends up shading the truth to make the math work. This is usually where accuracy quietly dies.
2. The Punishment of Honesty: Pad an estimate to account for the unknown, and the project risks going to a competitor who quoted lower. Give an honest, tight estimate instead, and if the work runs long for reasons outside anyone’s control, the project lead gets blamed for the overrun. Either way, honesty starts to feel like a double-edged sword.
3. Gamed Metrics: Once teams learn this honest number gets punished, they stop reporting straight and start managing perception instead (padding here, trimming there) until the estimate stops reflecting the work and starts reflecting office politics.
This is not a small group of unlucky teams. It is most teams, most of the time, and underestimation, overestimation, and no estimation at all each create their own kind of damage. Damage that rarely stays contained to a single project.
| Underestimation | Overestimation | No Estimation | |
| What Usually Happens | Team rushes, quality drops, scope creep goes unbilled | Project looks unattractive, bids get lost, budget sits unused | Work starts with no benchmark to measure against |
| The Costs to the Business | Margin erosion, burnout, client trust issues | Lost deals, wasted capacity, inflated pricing | No accountability, no early warning signs, pure guesswork |
| Client Relationship Impact | Client feels short-changed once quality slips | Client feels overcharged and shops around on the next project | Client has no reference point to trust future quotes |
| Team Impact | Burnout and quiet resentment toward planning in general | Idle stretches followed by sudden crunch elsewhere | Constant firefighting with no shared sense of progress |
| Pricing Impact | Quotes look competitive but erode margin once delivered | Quotes price the firm out of consideration entirely | Pricing set arbitrarily, disconnected from cost or market rate |
| Long-Term Pattern | Repeats project after project since the shortfall is rarely traced to its cause | Sales pipeline shrinks quietly as win rates drop | The organization never builds a reliable estimating history to learn from |
A line from logician Carveth Read sums this up better than most modern management books. “It is better to be vaguely right than exactly wrong.” (Deductive and Inductive, 1898). A rough estimate based on real data will serve a team better than a precise-looking number pulled out of thin air.
Knowing the estimation is broken is one thing. Knowing exactly which mental shortcuts break it is another, and this is where the chapter focuses next.
One would think experience fixes estimation issues. It does not, at least not on its own. Even seasoned project leads fall into the same traps because they are baked into how our brains work and not how much experience a person has.
Project teams look at a task and imagine the smoothest version of how it could go, the version where nobody gets sick, no client goes quiet for a week, and every handoff happens exactly on schedule. This is not a deliberate self-deception. Daniel Kahneman and Amos Tversky named this ‘The Planning Fallacy’ in 1977. Nearly five decades later, it is just as reliable. It is why the same team can miss the same type of deadline three projects in a row without noticing the pattern.
Someone throws out a number early in the meeting (maybe a client mentions a budget, maybe someone recalls that a similar project once took three weeks). Every estimate that follows drifts towards the first number, whether it makes sense for this specific project or not. This pattern can be traced to the anchoring bias in the 1974 paper ‘Judgement Under Uncertainty’. The anchor gets treated as informed guidance even when it was really just the first thing anyone happened to say out loud.
Teams often assume a project is special enough that past data doesn’t apply. Sometimes this is genuinely true: a new client, a new technology, a new market. Most of the time, though, it is an excuse to skip the harder work of pulling up the team’s own history and comparing it honestly, because this comparison might not favor the confident number already in mind. Planning scholar Bent Flyvbjerg built a method, ‘Reference Class Forecasting,’ around this blind spot. It starts with an estimate from ‘how a group of similar past projects actually turned out’, then adjusts for ‘what is genuinely different about the new one’.
Ask a team what a project will take, and they describe the deliverable: the drawings, the code, the report. Almost nobody describes the work around the deliverable, because none of it feels like work while it is happening. This is a belief about what counts, and it quietly shapes every number a team commits to. The same belief leaks into how work gets assigned. When only visible output counts, the most experienced person becomes the safest bet on paper and keeps getting loaded up. It is a classic assignment anti-pattern, and it starts with the same narrow view of what counts as work.
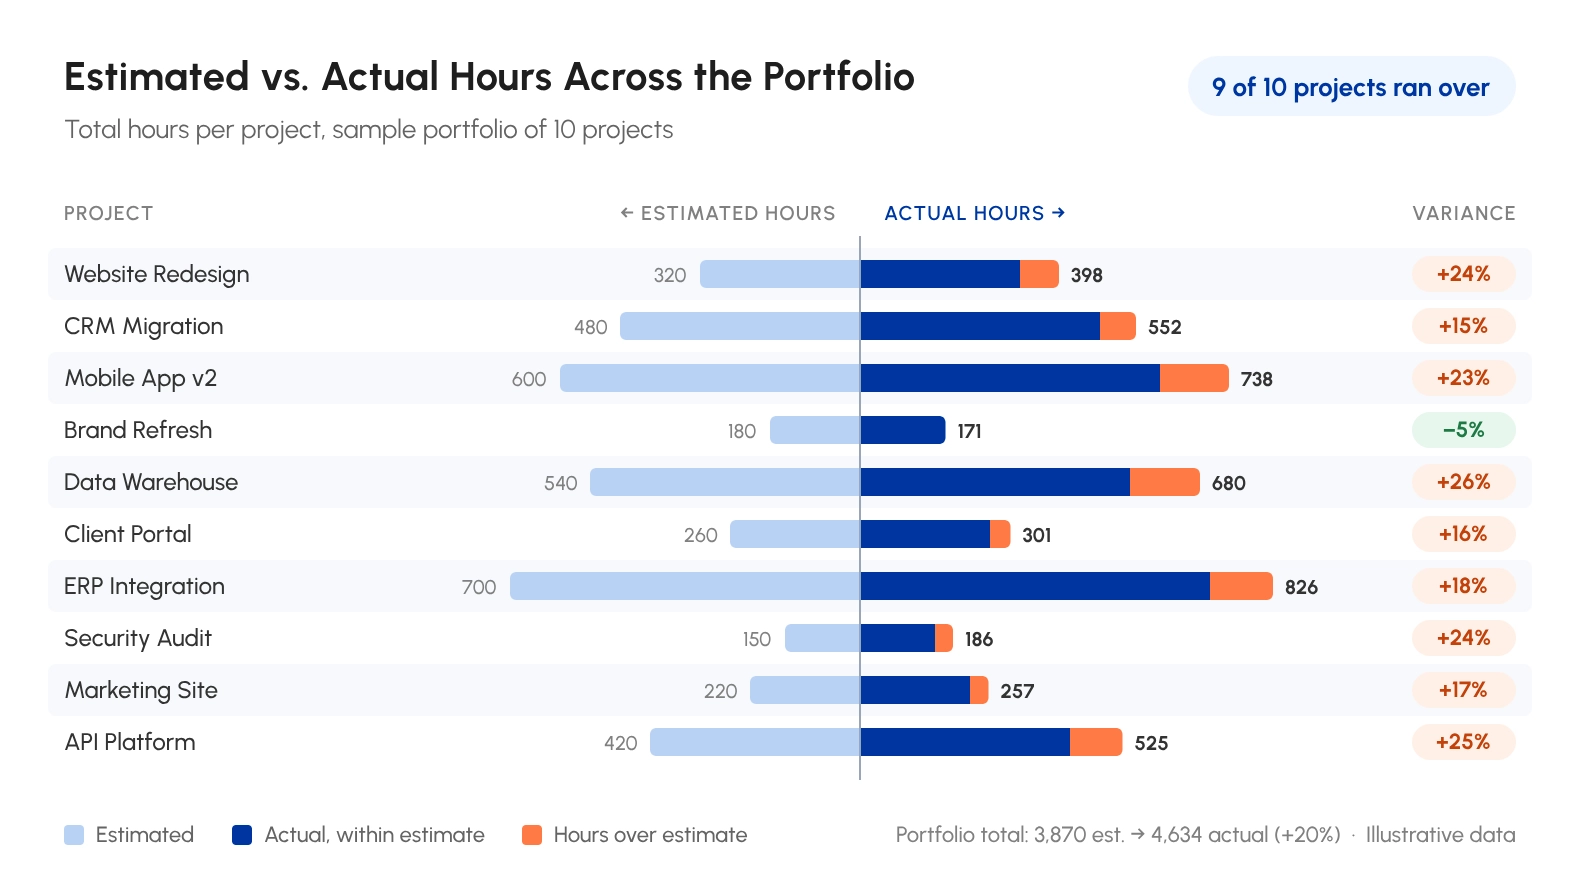
Teams assume the client will approve things on time, the vendor will deliver on schedule, and the third-party system will not go down at the worst possible moment. Dependencies outside anyone’s control get the most optimistic treatment, mostly because they cannot be influenced directly. Nobody wants to build a whole contingency plan around someone else’s schedule.
The more experienced a project lead is, the more likely they are to trust instinct over data. Often for good reasons, since this instinct has usually been right before. This same confidence, though, makes it less likely anyone will double-check the numbers before committing to them. This is exactly when a quiet blind spot turns into a very public overrun.
Most of these traps shrink once a team builds a habit around a few core resource estimation practices. Whether it is checking past project data before quoting, separating buffer time from padding, or revisiting estimates at each project milestone rather than only at the start.
These biases explain why estimates go wrong at the planning stage. But bad planning does not stay contained to the spreadsheet. It bleeds straight into the bottom line, and this is where the real cost shows up.
None of this requires a finance background to feel. The effects of bad estimation show up in margins quietly (month after month), and the strain shows up in staffing data too.
In June 2026, professional and business services recorded roughly 488,000 quits, a 2.2% quit rate. Turnover alone doesn’t prove a cause, but it reminds a manager that the sector’s workforce is far from settled, even as firms lean harder on the same few experienced people to hit delivery targets.
1. Projects are priced without understanding delivery cost: Sales teams quote based on what the client will accept, not on what the work will actually cost to deliver. The gap between these two numbers is where a firm’s profit either lives or disappears.
2. Valuable work goes untracked: Every unlogged hour of client calls, internal reviews, or quick favors is real cost with no corresponding entry anywhere. Unit labor costs rose 1.4 percent over the 4 quarters ending Q2 2026, even as productivity improved (Source). A sign that getting work done keeps costing more regardless of efficiency. It stays invisible until someone tallies up why a healthy-looking project barely broke even.
3. Scope changes are treated as free customer service: A client asks for one small addition, the team says yes to keep them happy. This small addition quietly eats into hours nobody billed for.
4. Teams are loaded beyond sustainable capacity: When estimates run short, the fix is usually to push harder rather than to plan better, which burns out an organization’s best people and slows down the next project too. Most estimates count heads rather than hours, so work that really needs 1.5 full-time equivalents gets handed to one person, and the difference turns into unbudgeted overtime.
5. High-revenue clients hide weak margins: A client bringing in a lot of revenue looks great on a dashboard, but delivering their work costs almost as much as they pay. This client might be contributing less profit than a smaller, tighter one. Revenue figures alone will never show it. Delivery hours per client will.
This pattern shows up most sharply in professional services, where the product being sold is quite literally a team’s time. Get the estimate wrong here, and a firm is not just late; it is unprofitable in a way that no amount of new client volume can fix on its own.
To understand why these decisions keep happening, it helps to look at what the estimate never accounted for in the first place.
Most estimates are built around the visible parts of work (coding, writing, designing, or building) that everyone agrees counts as real output. What is left out is everything happening around the core work, and it adds up faster than most teams expected.
Every time a person jumps from one task to another, they lose a chunk of focus getting back into flow. A landmark UC Irvine study found that people compensate for interruptions by working faster. The real cost, however, is more stress, higher frustration, and greater effort. A workday with a dozen small switches erases genuinely productive time and leaves behind the strain no estimates account for.
Picking a task back up after lunch, a meeting, or a weekend takes longer than picking up exactly where someone left off in their head. The first few minutes go to reorienting, rereading notes, remembering where a thought trailed off. None of this reorientation time makes it into anyone’s estimate, even though it happens multiple times a day.
People are not equally sharp at 9 AM and 4 PM. Most move through a predictable rise and fall in focus across the day: sharper in the morning and noticeably slower in the early afternoon. Estimates assume a flat, consistent output across every hour of the day. In reality, the output rises and falls throughout the day, which is one reason some teams experiment with flexible work timings that let people match their sharpest hours to their hardest tasks.
Teams add a buffer for the unknown. When this buffer is a personal guess rather than a number based on real history, it either overshoots, making the quote look bloated, or undershoots, leaving the project exposed the moment anything goes even slightly sideways.
A task described in one vague sentence in a project brief can mean wildly different things to people. One person reads it as a quick tweak, and another reads it as a near rebuild, often because nobody took time to properly define project scope before starting work. This gap in interpretation costs real time nobody planned for once the actual work begins.
Slack messages, quick calls, someone stopping by to ask, ‘got a minute’. They all take time away from focused work, yet almost nobody logs them as project hours. Over a busy week, this overhead can rival the time spent on a small task.
Work rarely moves forward in a straight line. It waits on someone else’s sign-off, sits in a shared queue behind another team’s priorities, or stalls because two people assumed the other had already moved it forward. None of this waiting looks like idle time on a calendar, but it delays delivery just as surely as a task that is actively being worked on. Almost no estimate accounts for how much of a project’s timeline is spent simply waiting on someone else’s turn.
Everyone adds a personal safety margin to their estimates (a little extra time for just-in-case scenarios). Nobody agrees on how big this margin should be, or even admits they are adding one. This results in the final number being an unspoken average of several people’s private guesses stacked on top of each other.
This is one of the clearest arguments for tracking resource utilization data properly instead of relying on memory or gut feel. Chasing a full-capacity utilization target often slows delivery down rather than speeding it up. A fully booked calendar leaves no room to absorb the very interruptions this section just addressed.
Once the gaps are in sight, the next question is how to capture them in a repeatable manner.
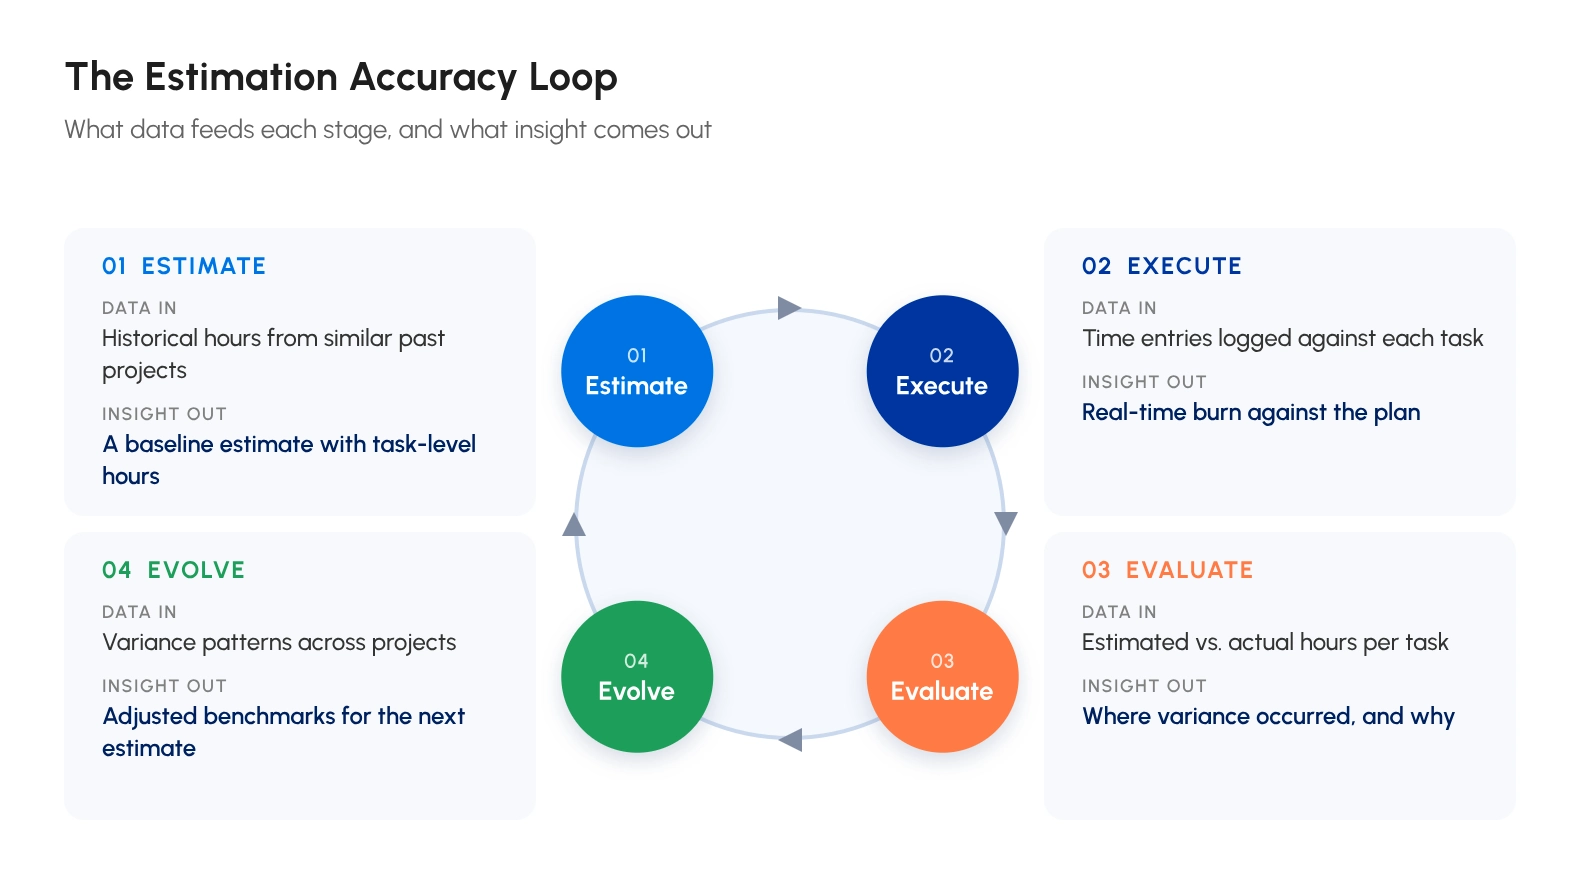
The Estimation Accuracy Loop is a simple, repeatable habit, not a complicated system. It treats every finished project as a data point rather than a one-off event, using what actually happened last time to make the next estimate a little more accurate.
It runs on four connected stages (known as the 4 Es), each one feeding directly into the next.
1. Estimate: A number is built from the team’s own tracked history rather than a fresh guess, using past projects of similar type as the starting reference point. This is the reference class forecasting applied to a team’s own data. It turns the first step in the loop into an act of recall instead of prediction, the point where most of the accuracy is won or lost.
2. Execute: Work happens as planned, with actual hours logged against the original task and project in real time, not reconstructed from memory afterwards. Logging simultaneously as the work happens keeps this stage honest.
3. Evaluate: Actual hours are checked against the original estimate, and every meaningful gap gets a reason attached to it: whether it is a missing dependency or an underestimated task type. Without this attached reason, the gap is just a number. Numbers without context rarely change behavior on the next project.
4. Evolve: This reason is built into the next similar estimate, turning a repeated mistake into a one-time lesson instead of a permanent habit. Most teams skip this step entirely, resulting in the same estimated mistakes surfacing project after project.
Running the loop consistently pays off in a few specific, compounding ways.
The next estimate stops being a fresh guess. It becomes an educated adjustment based on what the team actually did last time. The same underlying shift that lets tracked hours strengthen day-to-day project team management, not just billing accuracy.
This works regardless of which common project scheduling techniques a team already relies on to plan the work itself. Since the loop operates one layer above the method, on the accuracy of the inputs feeding it. Anyone wanting a refresher on the scheduling approaches most teams choose between will find the loop layers cleanly on top of any of them.
The loop is simple on paper. In practice, it usually stalls at one of three points.
1. Hours get logged at the end of the week: On a fully booked calendar, timesheets slide to Friday afternoon and get rebuilt from memory. The Execute stage depends on hours captured close to when the work happened. A week of reconstructed entries feeds the loop the same guesswork it was meant to replace.
2. Evaluate gets skipped: By the time a project closes, the next one is already waiting, and comparing actuals against the estimate starts to feel like a luxury. Without this review, there is no reason to carry forward, and Evolve has nothing to work with. Putting a short review into the close-out plan from day one keeps it from getting squeezed out.
3. Senior estimators push back on the data: When tracked history contradicts the number an experienced lead would have given, the instinct is to call the project an exception (the same trap from Bias 3). The fix is not to overrule experience; it is to ask what the past data missed. This way judgment and history reconcile out loud rather than one quietly winning.
An accurate estimate is only half the story, though. The other half is knowing where a project stands financially while it is still running, not three weeks after it closes.
Waiting for the final invoice to find out if a project was profitable is like checking a fuel gauge after the car has already stopped. These five metrics let a team check its numbers while there is still time to steer.
| Factor | Definition | Formula |
| Gross Project Margin | The percentage of revenue that is actual profit after paying for the people who did the work. | (Revenue – Direct Delivery Cost) ÷ Revenue × 100 |
| Hours Variance | A gap check between what was planned and what was actually spent. | Actual Hours – Estimated Hours |
| Client-Related Non-Billable Time | How much client time actually earns money versus how much gets absorbed by calls, revisions, and admin that is never invoiced. | Non-Billable Client Hours ÷ Total Client Hours × 100 |
| Unapproved Scope Share | The share of a phase’s direct expenses that went to just-one-small-thing work nobody billed for, turning vague scope creep into a number the client can see. | (Out of Scope Hours × Internal Cost Rate) ÷ Direct Expenses |
| Client Contribution | How much a specific client actually adds to the bottom line, separate from how much revenue they bring in on paper. | Client Revenue – Client-Specific Delivery and Servicing Cost |
Getting these numbers in real time depends entirely on how consistently a team logs its hours. This is where solid timesheet software earns its keep, turning scattered entries into numbers that can be acted on mid-project instead of after.
With hours logged daily and in real time, an enterprise engineering firm* bills a client $180,000 for a bridge inspection and structural reporting contract. The project was scoped at 900 hours at a blended internal cost rate of $140 an hour. This puts budgeted direct labor at $126,000 and the planned gross project margin at 30%.
By delivery, the team had logged 1,050 hrs. The 150-hour variance came from two places. Access restrictions at two of the six bridge sites added 110 hours. The other 40 hours came midway through, when the client asked for seismic load calculations outside the original scope, and the project lead quietly approved them without a change order. At $140 an hour, these 40 hours cost $5,600, close to 9% of the phase’s $63,300 in direct expenses.
Of the 1,050 hours, 140 hours went to client status calls, revised drawings, and stakeholder meetings that never made it onto an invoice. Close to 13% of the relationship’s total hours were delivered for free. Add it up, and actual direct labor lands at $147,000. The client pays $180,000, but the gross margin has slipped from 30% to about 18%.
A second client, a mid-size engineering firm in the firm’s portfolio, pays $95,000 for a similar engagement and costs just $58,000 to service. On headline revenue, the bridge client looks nearly twice as valuable. On contribution, the smaller client adds $37,000 to the bottom line against the bridge client’s $33,000, at more than double the margin.
*The firm's name is not shared to protect its privacy.
Metrics only matter if they change how a project actually feels to run. So what does it look like on the ground when a team finally gets this right?
The shift toward real-time profitability rarely surfaces as one dramatic before-and-after moment. It shows up as a handful of small, steady changes.
1. Every project covers labor and overhead costs: Teams stop discovering, weeks into delivery, that a project was underpriced from the start. The delivery cost is visible in near real time, so a project drifting toward the red shows up as a trend that can be caught, not a surprise that has to be absorbed.
2. Team members spend less time on low-value tasks: Once time becomes visible, low-value work becomes visible too. Tasks that quietly consume hours without moving a project forward get noticed, questioned, and either trimmed or handed to someone for whom they are a better use of time. Read alongside a few simple efficiency metrics, the same data shows whether the freed-up hours went somewhere that matters.
Myth: More billable hours always mean more profit.
Reality: More billable hours at the wrong margin can mean less profit. It is not about hours worked; it is
about what those hours actually cost to deliver.
3. Client invoices match or beat the target per-hour rate: Knowing the real delivery cost per client makes it possible to price with confidence instead of pricing on instinct, and stops discounting work out of habit just because a client pushed back.
4. Profit margins grow while total work hours stay steady: This is the real win, and it is worth sitting with for a moment. It does not require asking a team to work more. It simply means making sure the hours already being worked are counted, priced, and used well, which is a very different kind of growth than the kind that comes from burning people out.
Numbers and frameworks only prove their worth when they play out on an actual team. Here is what that looked like in practice.
An 850-person construction and architecture advisory firm was engaged for a $1.85 million, fixed-fee facility condition assessment program across 30 sites for a regional utility provider. This is the kind of engagement where advisory firms running multi-site technology rollouts earn their fee. This is also where estimation problems multiply fast simply because of scale.
Once the firm compared actual hours against its original per-site estimate, three recurring gaps stood out.
Cumulatively, these gaps added close to 35% more time per site than the estimate allowed. Not every extra week meant extra labor cost, since permitting waits stretch the calendar more than the payroll. Still, on a fixed-fee engagement, the overrun was enough to put the program on track for ~15% margin.
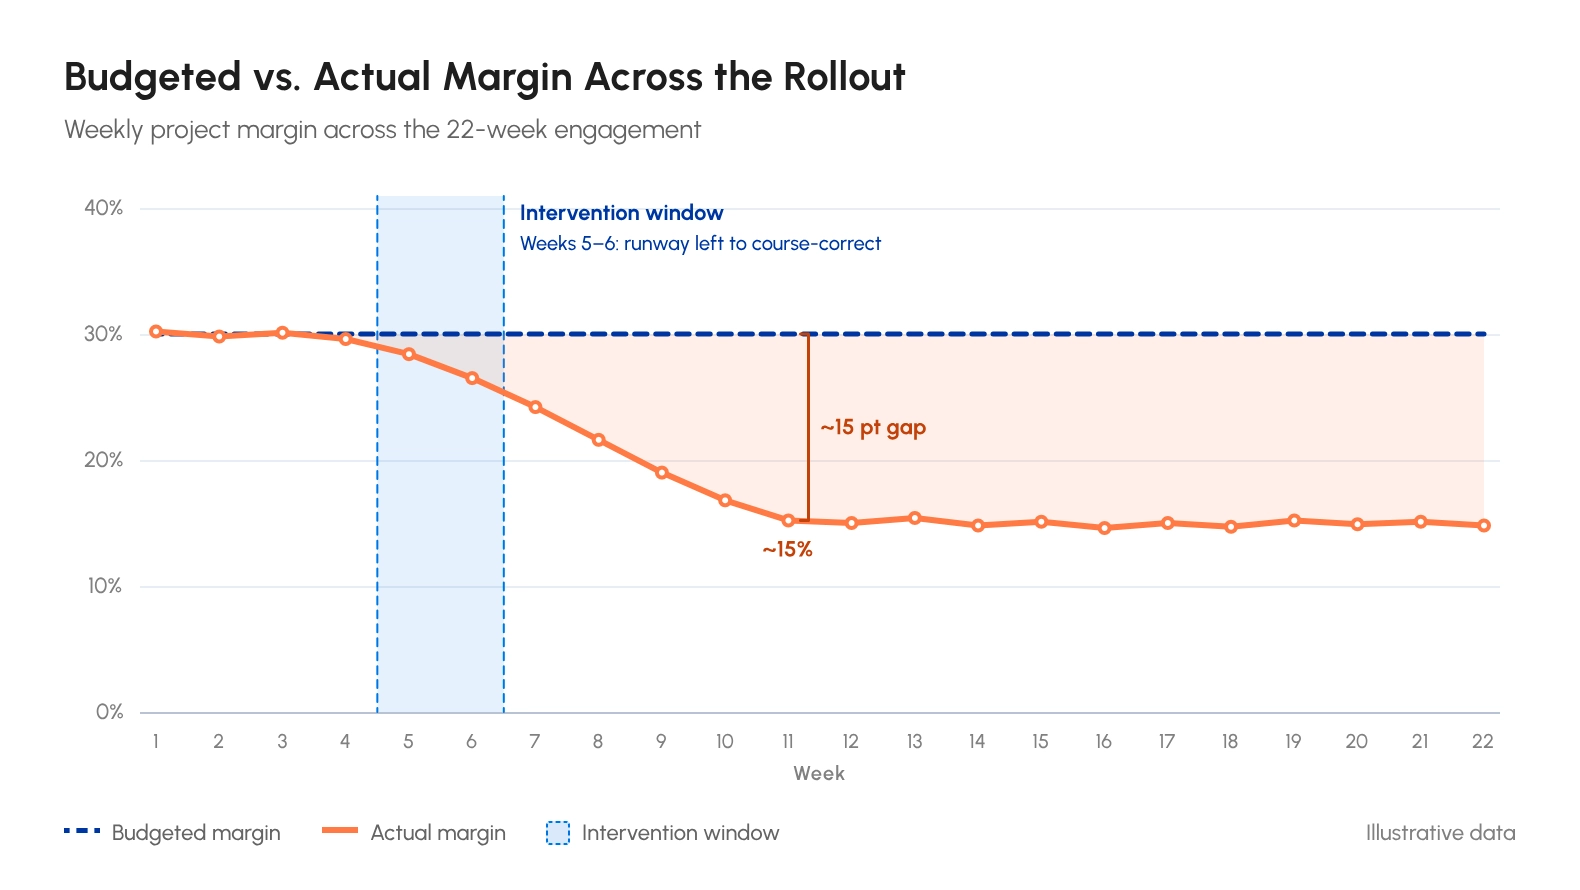
With this improved visibility, the firm:
Consolidating scheduling and time data into a single system played a real part in catching this drift early. This is the kind of visibility AEC consultancies get from a properly configured eResource Scheduler setup.
The bigger shift, though, was cultural rather than purely operational. Estimates stopped starting from a blank page and started building on what the last program proved true, which mattered as much to the firm's profitability as it did to keeping the client happy.
*The firm's name is not shared to protect its privacy.
This kind of course correction is only possible when estimation and profitability are treated as one connected system, not two separate departments checking in at different times.
When estimation and profitability finally talk to each other, the change is less dramatic than expected and a lot more durable.
None of this requires a bigger team or a longer workday. It just requires the same hours already being tracked, being used the right way.
| Signal From Tracked Data | Resulting Action |
| A new project resembles one already run before | The Estimation Accuracy Loop pulls the project’s data into the new estimate |
| Gross margin or hours variance starts drifting mid-project | The team checks it the same week |
| A task type keeps triggering coordination friction or context switching | The cost is named and built into the next similar estimate |
| A client asks for one more small thing | It is logged as unapproved scope cost and priced |
| Actual margin starts to diverge from budgeted margin | The gap is caught inside the intervention window while there is still time |
| One person keeps getting assigned the hardest work | Capacity is reassigned based on what utilization data actually shows |
| A project runs over | The overrun is traced to a specific bias or missing input |
| A client’s revenue looks large | Client contribution shows whether the revenue is profitable once delivery cost is subtracted |
None of this happens because a team suddenly gets smarter or works harder. It happens because the hours that were always being worked finally get counted, compared, and fed back into the next decision instead of disappearing into a spreadsheet nobody revisits. This is the entire shift, from treating every project as an isolated guess to treating every project as one more data point that makes the next estimate a little more honest.
Estimation and profitability are only two pieces of the picture, though. The hours behind them are not all equal. The next chapter looks at why this distinction matters more than most teams realize, and what it quietly costs organizations that blur the line between the two.

 ALL FEATURES INCLUDED