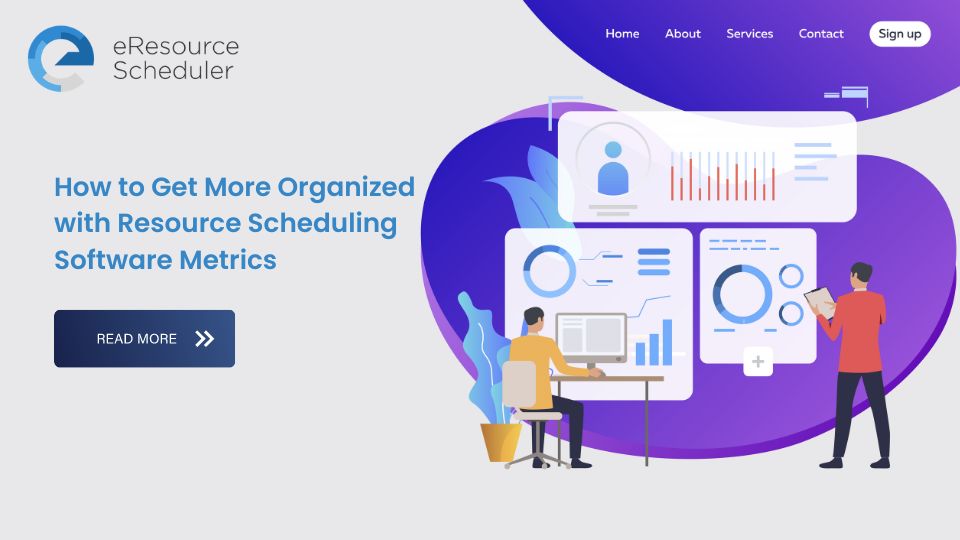
Want to know the secret to be more organized and productive? It’s not checklists and schedules, it’s actually data. Resource Scheduling Software Metrics is the key to managing your work, projects, and resources — effectively and efficiently.
Data also helps us assess our project success rate and understand whether everyone is putting in the right amount of effort. But what data should you be tracking?
Here are six crucial resource management data metrics that you should be tracking. We’ll also mention how these metrics can help keep you and your work more organised and efficient. So, let’s get started.
There are Resource Scheduling Software metrics for almost everything, but tracking too many can lead to micromanagement or a helicopter management style. Also, more metrics don’t always equate to better performance. It is choosing a few, but correct metrics that generate the best results.
We have made things simpler for you by highlighting the six essential resource scheduling software metrics that you should consider implementing. For each, we also provide how to calculate these.
Probably the most valuable and crucial metric to follow is resource capacity utilisation. What does this measure? It is the amount or percentage of a resource’s time that is allocated to tasks and projects. Tracking resource capacity utilisation makes it possible to maximise resource efficiency and billings. It will also indicate if your planning is on track.
The quickest and easiest way to calculate capacity utilisation is the following formula:
Working hours / Available hours = Utilisation rate
For example = 30 working hours / 40 available hours = 75% utilisation rate
Often, success is defined by how much money was spent. One resource scheduling metric that can help you keep a tab on the numbers is resource cost variance. It measures the difference between the projected budget and the actual budget. This metric is again communicated as a percentage of the total budget.
Sometimes, resource cost variance is also calculated by subtracting the resource’s actual expense from its earned value (billings). Studying cost variance provides insights on budget — are you overboard or under? It also keeps you updated on profit margins.
Star Tip - With cost variance, it’s critical to identify trends. Sometimes, a project or two may go over budget, but it’s no reason to panic. However, if you notice that all projects are exceeding initial spend, then it’s time to step in and identify where the error is occurring.
This metric measures the number of resources that were planned for a task or project versus how many were actually used. For instance, for a construction shift, you planned for 20 labourers to be there, but the project required only 15. The difference would be highlighted in this metric. This is one of the simplest metrics to calculate and it again informs one whether they’re planning effectively.
Planned time is the estimated time it will take to finish your task, project, or strategy. Actual or used time is the final time in which the work was completed. This metric is also known as time variance. This tool helps with long-term forecasting and planning. It also ensures that all resources are working at optimal capacity and not overburdened.
Calculating this metric is as follows:
Planned hours - actual hours = Time Variance
Example: 60 hours - 25 hours = 35 hours variance
The information you’ll get from this metric is helpful in understanding:
When you consistently use this metric, you’ll automatically become better at projecting planned vs. actual hours, which will reduce the time variance. In a resource management software , time variance is automatically tracked and with the help of AI (artificial intelligence), the platform will give you increased accuracy on how long a task will take. This will make you more organised as you will know exactly how much work you can take on and without putting undue stress on resources and systems.
Schedule variance helps you determine whether you are ahead of or behind your schedule while the project is still in process. It helps you manage resources effectively, prioritise deliverables, and manage stakeholder expectations if you identify a delay.
The formula for schedule variance is:
Earned Value - Planned Value = Schedule Variance
The planned value can be computed by multiplying the amount of budget that has been used by the budget at completion (BAC).
Earned value is found by multiplying the percentage of work completed by BAC.
Example: Rs 100,000 is BAC
Amount of budget used till now = Rs 56,000.
Planned Project Schedule = 3 months
Time Till Date = 1 month
Planned percent of project complete = 33%
Actual percent of project complete = 20%
PV = (33%) x Rs 100,000 = Rs 33,000
EV= (20%) x Rs 100,000 = Rs 20,000
SV = 20,000 - 33,000 = -Rs 13,000
The negative result shows that the project is behind schedule. As a manager, you immediately know that you have to step in and identify what is causing the delay. Mismatch of resources? Insufficient resources?
Timely project delivery is critical to a company’s bottom line. When projects are delayed, an organisation stands to lose financially. Also, in any firm, there are multiple projects running simultaneously. Measuring the percentage of projects completed on time can help you understand and organise processes better. What was the difference between the projects that were delivered on time versus those that weren’t.
As a part of calculating the percentage of projects completed on time, you can also measure start time variance. For projects to be completed on time, they first have to start on time. To calculate start time variance, compare the planned project start date vs. the actual project start date. Tracking this metric early on in the project will identify which projects may struggle to hit the deadline and therefore might need some tweaking.

Tracking these six resource scheduling software metrics consistently will help you plan, prioritize, and execute projects better — all of which allude to being organized.
eRS is a real-time solution that gives you vigilance over what’s happening and the power to juggle multiple projects. Furthermore, it organises the data across the entire resource pool and organisation. With eRS, you have the time to focus on the more important aspects of your business like building a strong employee culture, delighting the customer, and increasing sales.


Plan Smarter. Schedule Faster. For Free.
Join thousands already using eResource Scheduler to align teams, time, and tasks seamlessly.
 ALL FEATURES INCLUDED